Northern Greenland
A new five-year project aimed at drilling through the ice to the underlying bedrock in four areas of northern Greenland promises to reveal the ice sheet’s past in unprecedented detail and enable more accurate predictions of how it may add to rising seas in the 21st century.
Greenland
Northern Greenland
A new five-year project aimed at drilling through the ice to the underlying bedrock in four areas of northern Greenland promises to reveal the ice sheet’s past in unprecedented detail and enable more accurate predictions of how it may add to rising seas in the 21st century.
Photo: Marco Tedesco, polar scientist, works on the edge of a glacier during one of his eleven expeditions to Greenland. Drone photo.
Alaska
Kotzebue Sound in northwestern Alaska
A multidisciplinary team led by Christopher Zappa from the Lamont-Doherty Earth Observatory has been working with community elders to study the climate-related changes in sea ice and marine life in the Kotzebue Sound. This unique community-based research project, Ikaaġvik Sikukun (Iñupiaq for ice bridges), combined decades of knowledge from the elders with data science, the use of unoccupied aerial vehicles, and documentary filmmaking to understand the impact that climate change has had on the area and the Indigenous way of life.
Photo: The city of Kotzebue, Alaska is seen from a U.S. Coast Guard helicopter on July 17, 2013. Credit: Shawn Eggert/U.S. Coast Guard
Western Coastal U.S.
Coastal Oregon and British Columbia
Aboard Lamont-Doherty’s R/V Marcus G. Langseth, one of the large global-class research vessels within the U.S. Academic Research Fleet, marine geophysicist Suzanne Carbotte led a sea-going expedition to investigate the Cascadia Subduction Zone. This subduction zone has been the site of past “megathrust” earthquakes, which are the largest earthquakes that happen on Earth. The Langseth is a unique ship within the research fleet, equipped for advanced seismic imaging, with a high-quality sound source and capable of towing an array of listening devices called hydrophones up to 15 kilometers long behind the ship to listen to the echoes returned from the seafloor and deep below. The team went to find and map the hidden “megathrust” fault deep beneath the seafloor that ruptures in these giant earthquakes.
Photo: Graduate student Michelle Lee examines just-acquired seismic data. Credit: Suzanne Carbotte
South Asia
Brahmaputra River
By examining tree rings, which showed rainfall patterns going back centuries before instrumental and historical records, Observatory scientists studied seven centuries of water flow in south Asia’s mighty Brahmaputra River. Their findings suggest that scientists are underestimating the river’s potential for catastrophic flooding as climate warms.
Photo: Lamont-Doherty Earth Observatory scientists calculated past rainfall and river discharges by measuring the rings of ancient trees within or near the Brahmaputra watershed. Here, researcher Dorji Dukpa of Bhutan’s Department of Forest and Park Services extracts a core from a Himalayan hemlock. Credit: Paul Krusic/University of Cambridge
South Asia
Antarctica
Amery Ice Shelf
Using a combination of radar images from satellites and a laser instrument on NASA’s ICESat-2 satellite, glaciologist Jonathan Kinglake and team observed the sudden drainage of a large, deep, ice-covered lake within an Antarctic ice shelf—a rare phenomenon that could be interpreted as an ominous sign for the future survival of the ice sheet, and potential global sea-level rise.
Photo: At center, the fractured ice of a doline on the Amery Ice Shelf. Credit: NASA
India
Mumbai
If global warming continues unchecked, summer monsoon rainfall in India will become stronger and more erratic. This is the central finding of an analysis that compared more than 30 state-of-the-art climate models from all around the world. The study, coauthored by Lamont-Doherty’s Anders Levermann, predicts more extremely wet years in the future—with potentially grave consequences for the well-being, economy, and food systems of more than a billion people.
Photo: Global warming is predicted to increase river flooding worldwide. Here, a family crosses an unbridged river. Credit: Kevin Krajick
South America to Greenland
Tracing the dinosaur journey from South America to Greenland
By meticulously matching up ancient magnetism patterns in rock layers at fossil sites across South America, Arizona, New Jersey, Europe, and Greenland, an Observatory study suggests that sauropodomorphs—a group of long-necked, herbivorous dinosaurs that eventually included Brontosaurus and Brachiosaurus—first appeared in what is now Greenland around 214 million years ago. To get there from South America, when the CO2 levels dipped 215-212 million years ago, perhaps the tropical regions became more mild and the arid regions became less dry. There may have been some passageways, such as along rivers and strings of lakes, that would have helped sustain the herbivores along the 6,500-mile journey to Greenland, where their fossils are now abundant.
Image: Map shows how the major continents were arranged 220 million years ago in the Pangea supercontinent. “Isch” and “P” mark locations with sauropodomorph fossils up to 233 million years old. The herbivorous dinosaurs didn’t reach Jameson Land in Greenland (“JL”) until about 214 million years ago. Credit: Dennis Kent and Lars Clemmensen
Africa
Democratic Republic of the Congo capital Kinshasa and Republic of Congo capital Brazzaville
Atmospheric scientist Daniel Westervelt and Columbia University undergraduate student Celeste McFarlane produced the first-ever ambient fine particulate matter (PM2.5) dataset in Kinshasa and Brazzaville and found average PM2.5 concentrations that suggest unhealthy levels of human exposure, which, over time can lead to cardiopulmonary problems and premature death.
Photo: Two capital cities—Kinshasa and Brazzaville—on opposite banks of the Congo River. Brazzaville (the capital and largest city of the Republic of the Congo) is on the north side of the river, and Kinshasa (the capital and largest city of the Democratic Republic of the Congo) is on the south side. Credit: NASA
United States
U.S. Agricultural Regions
Lamont-Doherty researchers studied hour-by-hour rainfall patterns recorded by hundreds of weather stations in the agricultural regions of the U.S. West, South, and Northeast each year from 2002 to 2017 and compared the rainfall patterns to crop yields. They found that intensified rain storms predicted for many parts of the United States as a result of warming climate may have a modest silver lining: they could more efficiently water some major crops, and this would at least partially offset the far larger projected yield declines caused by the rising heat itself.
Photo: Expected precipitation conditions are an important influence on rainfed agriculture. Credit: USDA.gov
Europe
France, Germany, British Isles
Lamont-Doherty researchers studying historical records, using the Old World Drought Atlas, which reconstructs soil moisture conditions over Europe, find that the devastating European Great Famine of 1315-1317 occurred at a time of excessively wet conditions, which made planting difficult, crop yields poor, and frequently made it difficult to transport what could be harvested to market. The consequence was massive crop and market failures, which led to widespread death and starvation; in some places, infanticide and cannibalism were reported, which purportedly gave rise to the Hansel and Gretel fairy tale. Famine spread across the British Isles, France, the low countries, and Germany, and approximately 10-25 percent of Europe’s population perished. These findings leave open critical questions about how to interpret the risks of droughts and deluges into the next century and how they will be influenced by both natural variability and the ever-evolving effects of human-caused climate change.
Photo: An old oak from Norfolk, England that was used in the construction of the Old World Drought Atlas. Credit: Richard Cooper/University of East Anglia
Greenland
Northern Greenland
A new five-year project aimed at drilling through the ice to the underlying bedrock in four areas of northern Greenland promises to reveal the ice sheet’s past in unprecedented detail and enable more accurate predictions of how it may add to rising seas in the 21st century.
Photo: Marco Tedesco, polar scientist, works on the edge of a glacier during one of his eleven expeditions to Greenland. Drone photo.
Alaska
Kotzebue Sound in northwestern Alaska
A multidisciplinary team led by Christopher Zappa from the Lamont-Doherty Earth Observatory has been working with community elders to study the climate-related changes in sea ice and marine life in the Kotzebue Sound. This unique community-based research project, Ikaaġvik Sikukun (Iñupiaq for ice bridges), combined decades of knowledge from the elders with data science, the use of unoccupied aerial vehicles, and documentary filmmaking to understand the impact that climate change has had on the area and the Indigenous way of life.
Photo: The city of Kotzebue, Alaska is seen from a U.S. Coast Guard helicopter on July 17, 2013. Credit: Shawn Eggert/U.S. Coast Guard
Western Coastal U.S.
Coastal Oregon and British Columbia
Aboard Lamont-Doherty’s R/V Marcus G. Langseth, marine geophysicist Suzanne Carbotte led an expedition to investigate the Cascadia Subduction Zone, site of past “megathrust” earthquakes, which are the largest on Earth. The Langseth is a unique ship within the research fleet, equipped for advanced seismic imaging, with a high-quality sound source and an array of hydrophones to listen to the echoes returned from the seafloor and deep below. The team went to find and map the hidden
“megathrust” fault deep beneath the seafloor that ruptures in these giant earthquakes.
Photo: Graduate student Michelle Lee examines just-acquired seismic data. Credit: Suzanne Carbotte
South Asia
Brahmaputra River
By examining tree rings, which showed rainfall patterns going back centuries before instrumental and historical records, Observatory scientists studied seven centuries of water flow in south Asia’s mighty Brahmaputra River. Their findings suggest that scientists are underestimating the river’s potential for catastrophic flooding as climate warms.
Photo: Lamont-Doherty Earth Observatory scientists calculated past rainfall and river discharges by measuring the rings of ancient trees within or near the Brahmaputra watershed. Here, researcher Dorji Dukpa of Bhutan’s Department of Forest and Park Services extracts a core from a Himalayan hemlock. Credit: Paul Krusic/University of Cambridge
Antarctica
Amery Ice Shelf
Using a combination of radar images from satellites and a laser instrument on NASA’s ICESat-2 satellite, glaciologist Jonathan Kinglake and team observed the sudden drainage of a large, deep, ice-covered lake within an Antarctic ice shelf—a rare phenomenon that could be interpreted as an ominous sign for the future survival of the ice sheet, and potential global sea-level rise.
Photo: At center, the fractured ice of a doline on the Amery Ice Shelf. Credit: NASA
India
Mumbai
If global warming continues unchecked, summer monsoon rainfall in India will become stronger and more erratic. This is the central finding of an analysis that compared more than 30 state-of-the-art climate models from all around the world. The study, coauthored by Lamont-Doherty’s Anders Levermann, predicts more extremely wet years in the future—with potentially grave consequences for the well-being, economy, and food systems of more than a billion people.
Photo: Global warming is predicted to increase river flooding worldwide. Here, a family crosses an unbridged river. Credit: Kevin Krajick
South America to Greenland
Tracing the dinosaur journey from South America to Greenland
By matching up ancient magnetism patterns in rock layers at various fossil sites, an Observatory study suggests that sauropodomorphs first appeared in Greenland around 214 million years ago. To make the 6,500-mile journey, when the CO2 levels dipped 215-212 million years ago, perhaps the tropical regions became more mild and the arid regions less dry.
Image: Pangea supercontinent 220 million years ago. “Isch” and “P” mark locations with sauropodomorph fossils up to 233 million years old; they didn’t reach Jameson Land in Greenland (“JL”) until about 214 million years ago. Credit: Dennis Kent and Lars Clemmensen
Africa
Democratic Republic of the Congo capital Kinshasa and Republic of Congo capital Brazzaville
Atmospheric scientist Daniel Westervelt and Columbia University undergraduate student Celeste McFarlane produced the first-ever ambient fine particulate matter (PM2.5) dataset in Kinshasa and Brazzaville and found average PM2.5 concentrations that suggest unhealthy levels of human exposure, which, over time can lead to cardiopulmonary problems and premature death.
Photo: Two capital cities—Kinshasa and Brazzaville—on opposite banks of the Congo River. Brazzaville (the capital and largest city of the Republic of the Congo) is on the north side of the river, and Kinshasa (the capital and largest city of the Democratic Republic of the Congo) is on the south side. Credit: NASA
United States
U.S. Agricultural Regions
Lamont-Doherty researchers studied hour-by-hour rainfall patterns recorded by hundreds of weather stations in the agricultural regions of the U.S. West, South, and Northeast each year from 2002 to 2017 and compared the rainfall patterns to crop yields. They found that intensified rain storms predicted for many parts of the United States as a result of warming climate may have a modest silver lining: they could more efficiently water some major crops, and this would at least partially offset the far larger projected yield declines caused by the rising heat itself.
Photo: Expected precipitation conditions are an important influence on rainfed agriculture. Credit: USDA.gov
Europe
France, Germany, British Isles
Lamont-Doherty researchers studying historical records, using the Old World Drought Atlas, find that the devastating European Great Famine of 1315-1317 occurred during excessively wet conditions. The consequence was massive crop and market failures. Famine spread across the British Isles, France, low countries, and Germany, and 10-25 percent of Europe’s population perished. These findings leave open critical questions about interpreting the risks of droughts and deluges into the future, and how they will be influenced by natural variability and human-caused climate change.
Photo: An old oak from Norfolk, England that was used in construction of Old World Drought Atlas. Credit: Richard Cooper/University of East Anglia


SCIENTIFIC EXPLORATION
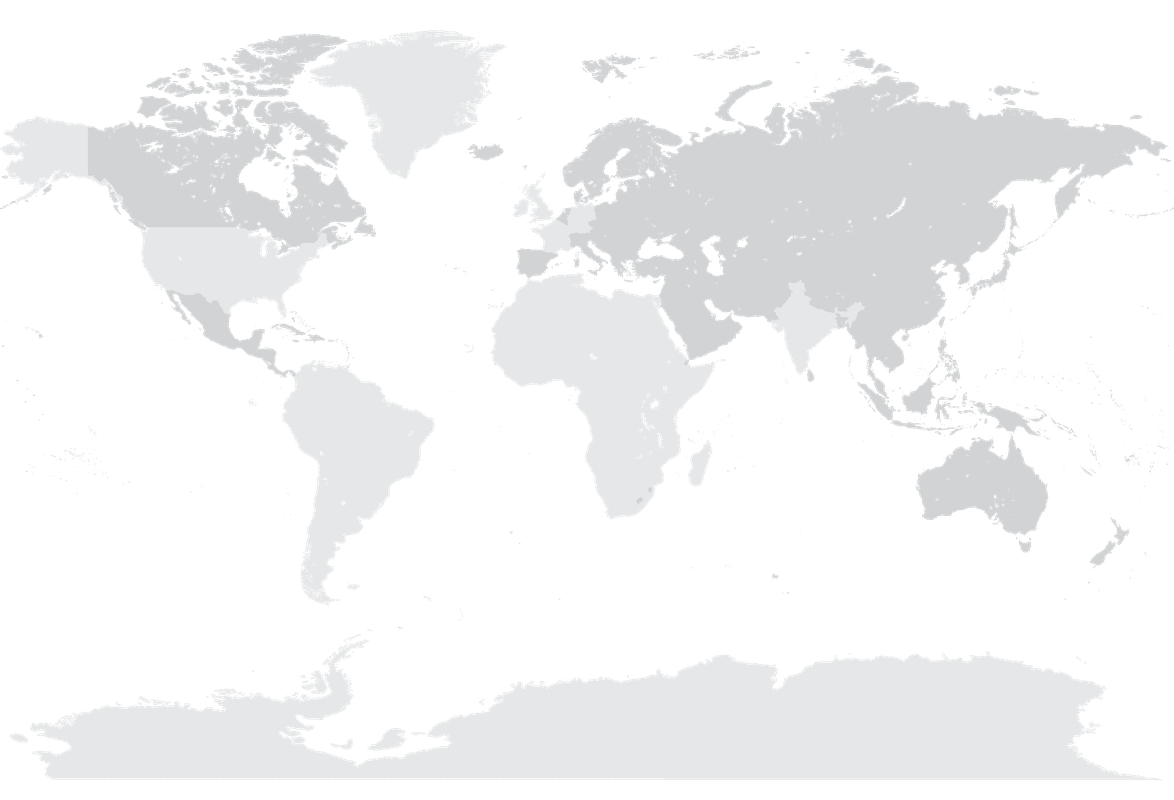
Click a location to learn more.


We highlight the range of Lamont-Doherty exploration during fiscal year 2021. Click a location to learn more.
Scientific Exploration
Writer/Editor: Marie DeNoia Aronsohn I Contributing Editors: Tara Spinelli and Marian Mellin I Contributing Writer: John Palmer I Design: Carmen Neal
Columbia Climate School Lamont-Doherty Earth Observatory Annual Report FY2021
© 2021 by The Trustees of Columbia University in the City of New York, Lamont-Doherty Earth Observatory. All rights reserved.
Writer/Editor: Marie DeNoia Aronsohn
Contributing Editors: Tara Spinelli and Marian Mellin
Contributing Writer: John Palmer
Design: Carmen Neal
Columbia Climate School Lamont-Doherty Earth Observatory Annual Report FY2021
© 2021 by The Trustees of Columbia University in the City of New York, Lamont-Doherty Earth Observatory. All rights reserved.

